
The Ohio House has proposed ending the Ohio Motion Picture Tax Credit
as a means to help fund a reduction in state income taxes.
We believe to eliminate the tax credit is a
GRAVE ERROR that will do great damage to our economy and to so many Ohio taxpayers who either work in media production, run a business that works with the media production industry or dream of someday working in this industry right in their own backyard.
The success of the Ohio Motion Picture Tax Credit is real and demonstrable.
To see how you can help save Ohio film jobs, click
HERE.
The MPAA reports on the industry impact (jobs/wages), and numbers are updated annually following the release of the prior year's Bureau of Labor Statistics (BLS) data.
Movie & TV Production: By the Numbers1
- 2015-2016: During the course of 2015 and 2016, 28 movies and 5 TV series filmed in Ohio. Movies include The Fate of the Furious, Bye Bye Man, UFO, Trouble, Blood on Wheels, My Blind Brother, and In Search of Fellini. TV series include Fat n' Furious: Rolling Thunder, Lachey's Bar and Preach.
- Impact: While shooting on location, a major motion picture contributes an estimated $250,000 per day, and a single one-hour television episode contributes $150,000 per day, to the local economy.
- In 2014 and 2015, film and TV productions spent $22.6M in the Cincinnati area, directly employing 4,331 people.2
- Historic: Key titles that filmed in whole or in part in Ohio include Captain America: The Winter Soldier, The Avengers, Draft Day, The Ides of March, Parker, Touchback, Spider-Man 3, The Soloist, Air Force One, Antwone Fisher, A Christmas Story, Major League, Men in Black, Shawshank Redemption, Rain Man, Redemption, Silence of the Lambs, Tango & Cash and Traffic.
- Captain America: The Winter Soldier spent an estimated $35M in Ohio over approximately 150 days, creating roughly 2,778 Ohio jobs and opportunities.3
- The Avengers spent more than $25M in Ohio in 2011, employing 3,875 Ohioans.4
- Production Incentive: The tax incentives for Ohio include refundable credits for film, TV, video and digital media equal to 30% of production expenditures (with a minimum in-state spend of $300,000) including out-of-state wages. There is an annual $40M cap on available credits.
- From July 2011 through June 2015, 31 productions received a total of $32.6M in Ohio tax credits. These productions contributed to more than 1,700 jobs, $70M in wages, and $225M total output impact to Ohio's economy.8
 Economic Impact of the Motion Picture & TV Industr
- The motion picture and television industry is responsible for more than 35,500 jobs and $1.2B in total wages in Ohio, including indirect jobs and wages.
- Nearly 11,700 people are directly employed by the motion picture and television industry in Ohio, including 2,974 production related employees.
- There are 2,080 motion picture and television industry businesses in Ohio, including 1,200 production-related companies.9
- MPAA member companies paid $17M to 851 vendors in Ohio in 2016. These local businesses include transportation, retail, hardware, and technology. Since 2012, MPAA members have paid on average $27M per year to local vendors in Ohio.
Download MPAA Report for Ohio HERE
Download MPAA Report for the U.S. HERE
1 Film commission listing and industry sources. Includes only feature films and TV series, not individual episodes, documentaries, specials, or other programming.
2 Cincinnati.com, "Why an expanded film incentive matters to Cincinnati," 7/8/2016.
3 Ohio Development Services Agency, "Ohio Motion Picture Tax Credit Helps Lure New Captain America Movie," 9/28/2012.
4 Cleveland State University, Analysis and Economic Impact of the Film Industry in Northeast Ohio and Ohio, March 2012.
5 U.S. Bureau of Economic Analysis (BEA), Bureau of Labor Statistics (BLS) data as of year end 2016. U.S. Census Bureau data as of July 1, 2016.
6 BLS Data, using SIC to NAICS bridge. Production-related includes motion picture and video production, independent motion picture production artists and technicians, production-related businesses, post-production, re-production and studio distribution. Consumer distribution-related includes motion picture theaters, video wholesale and rental operations, television broadcasting, cable and other subscription programming. Total jobs calculated using RIMS II model of the BEA and some additional film/TV specific employment in other industries (e.g. retail). Data as of year end 2015.
7 Analysis of studio submissions received, using additional detail to ensure greater accuracy in estimating the number of vendors paid. Data as of year end 2016.
8 Cleveland State University, Box Office Ohio: Analysis and Economic Impact of the Film Industry in Northeast Ohio and Ohio, June 2015.
9 Analysis of Dun & Bradstreet industry reports. Data as of year end 2016.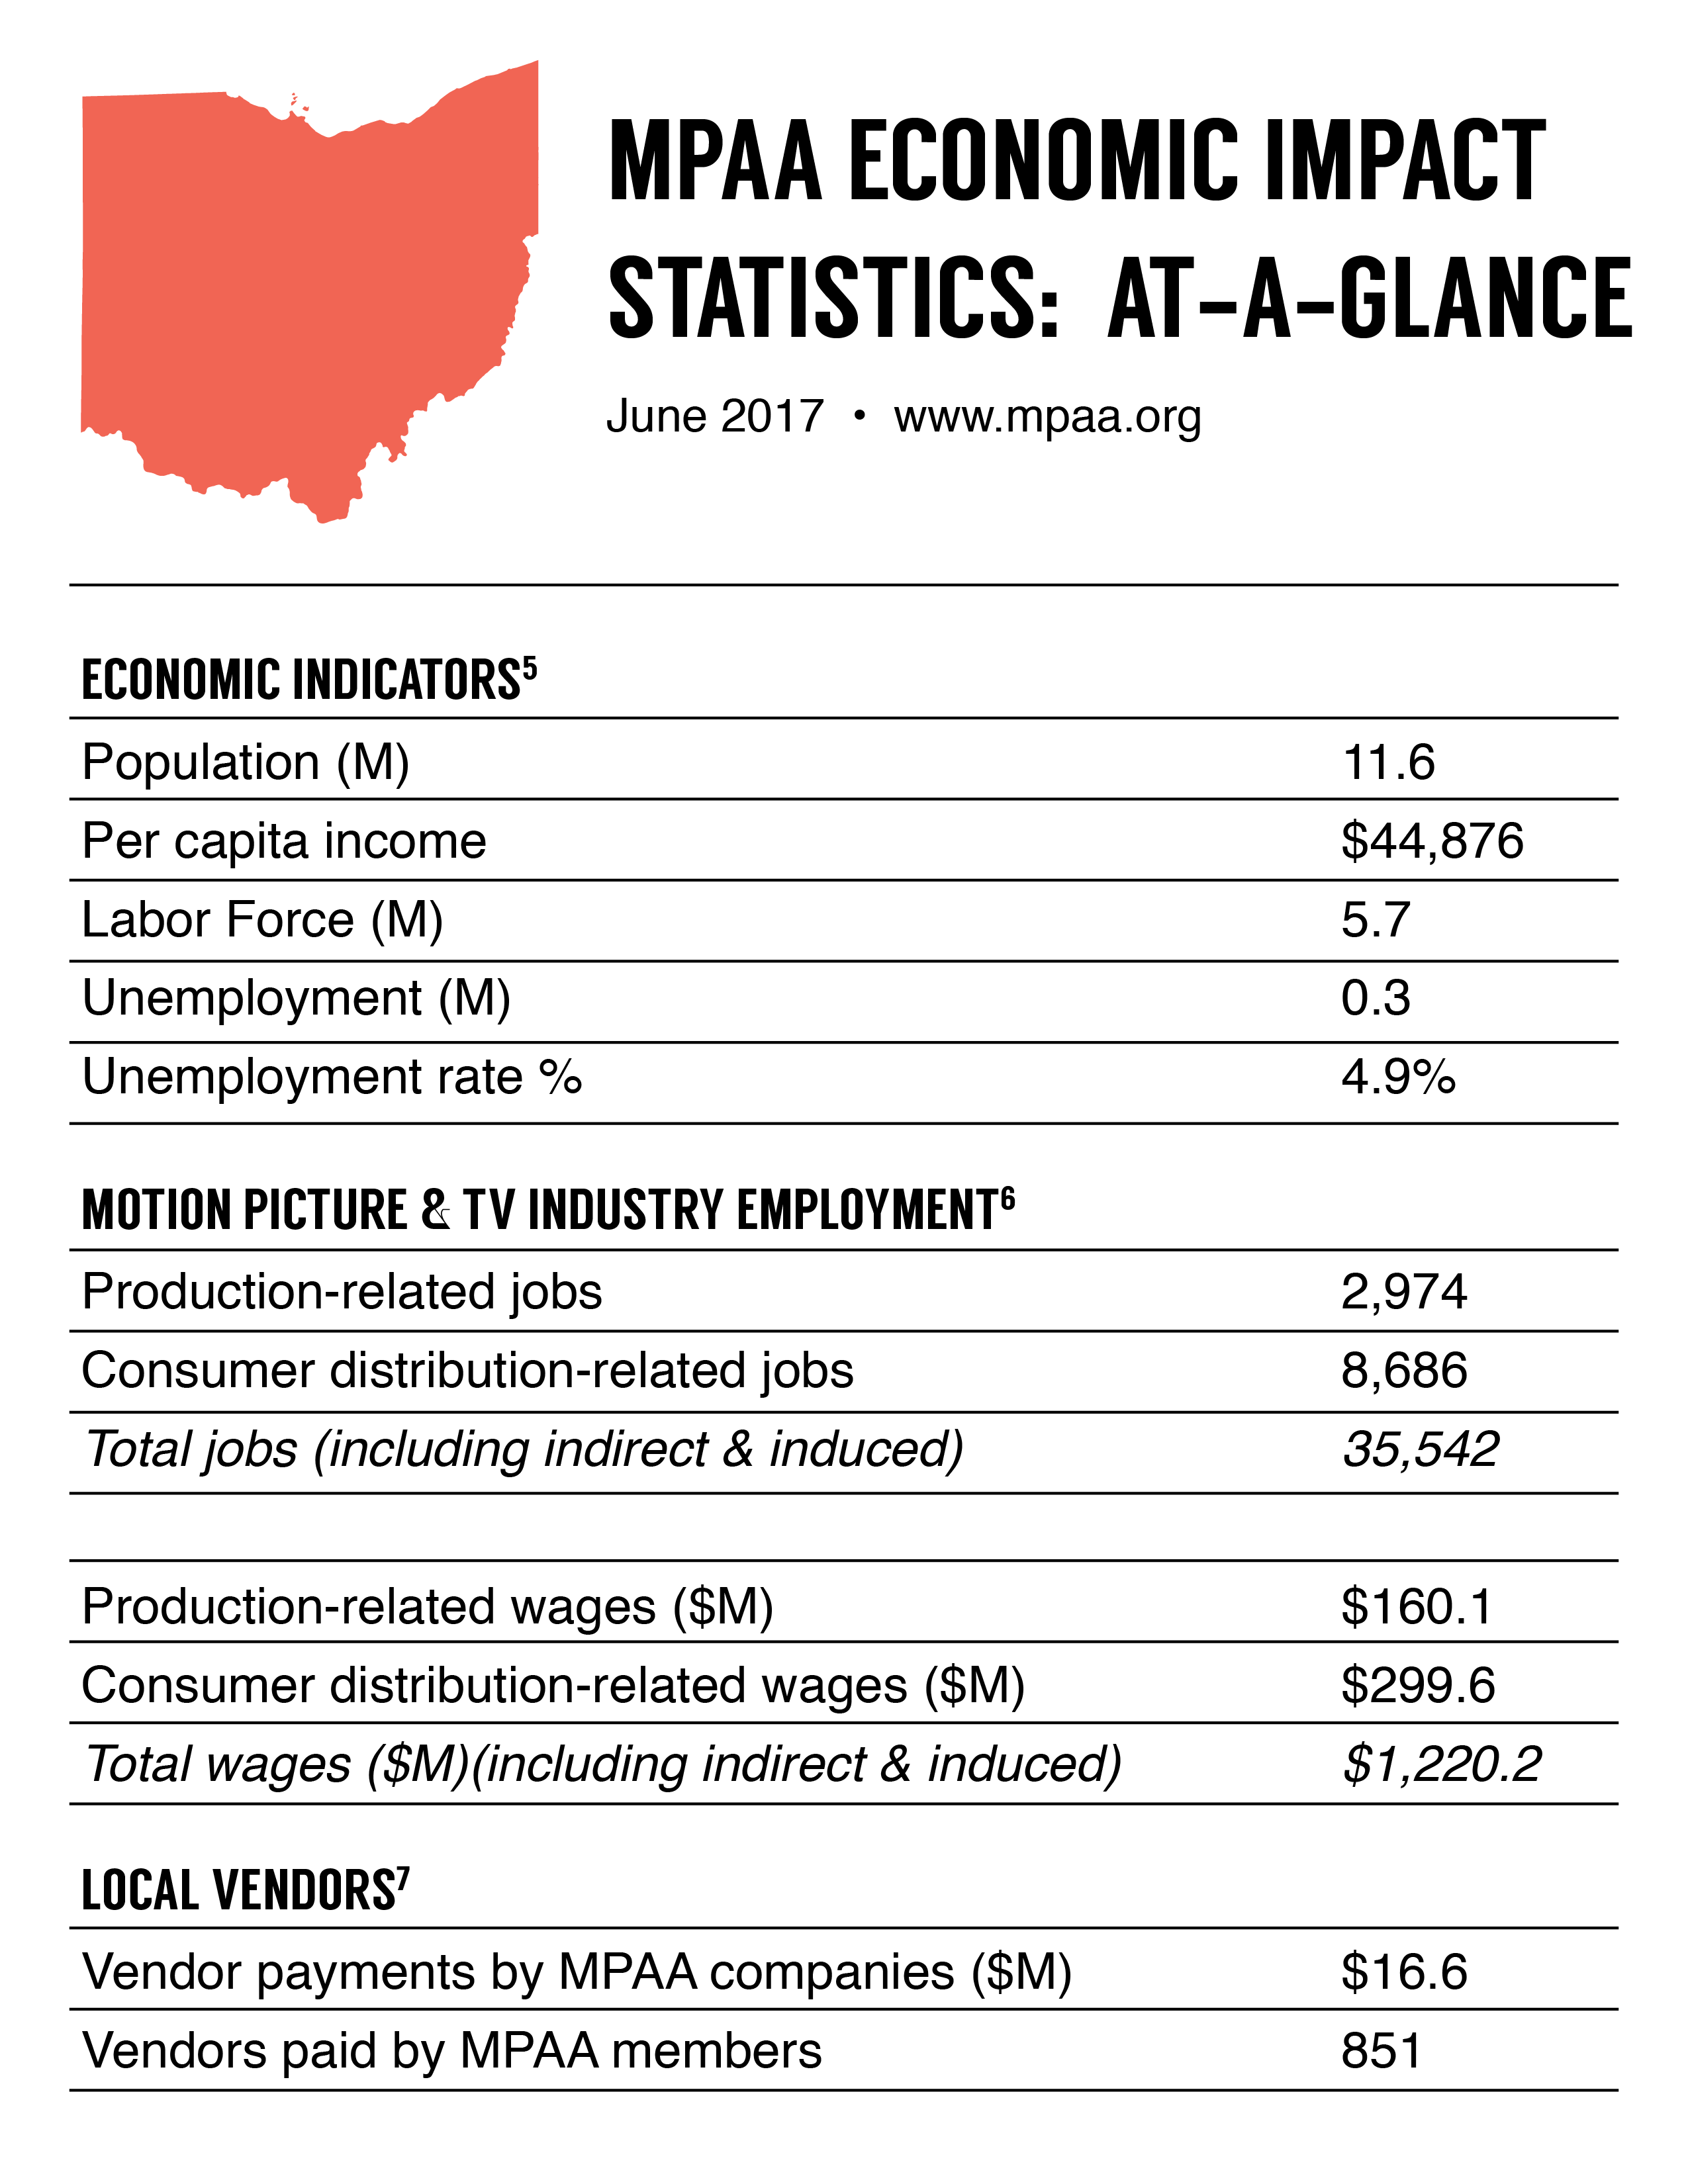 Economic Impact of the Motion Picture & TV Industr